In our second blog post, we will take a quick look at another processing step, this time related to stock and index prices rather than text.
At Reckoning Machines we’ve built pipelines to ingest transcripts, filings, macro economic data, and prices.
Post processing of prices includes building the foundation for a machine learning approach to stock picking.
This foundational data we call the “betas table.”

In the above example we have JP Morgan, its close, rsi (we calc a bunch of indicators) and the example of one day alpha, thirty day alpha, and earnings day alpha.
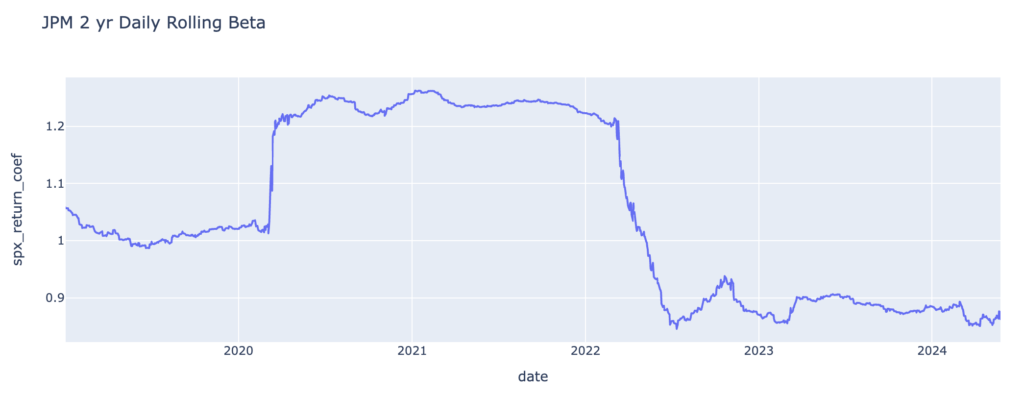
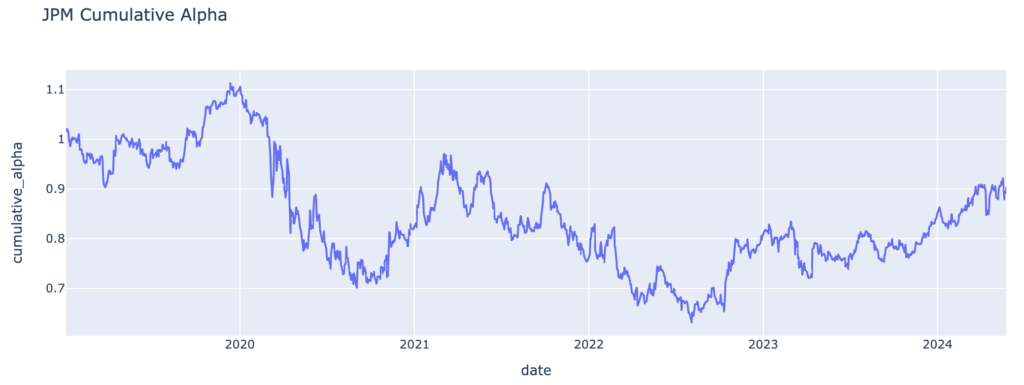
One day alpha means: the stock’s return in excess of its beta for that day. We calculate rolling daily 2 year betas.

Thru the pandemic JPM’s beta bumped up, then mean-reverted to the relative safe haven that it is while the industry is suffering from higher rates and bank failures.
JPM alpha, or daily excess return vs the market, shows a pattern of outperformance vs the market since the bank failures of early 2023.

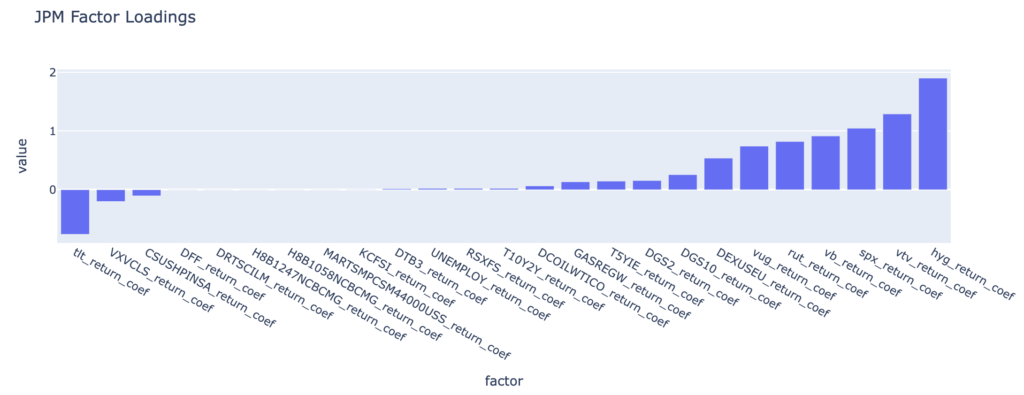
As we move forward towards actual stock-picking, we will be interested in what DRIVES JPM stock? As shown, we calculate “factor loadings” or regression coefficients for several different macro economic indicators and indices to help provide a profile for each company. In this case, it’s pretty simple, as JPM is largely a credit / value / market play offset by rates.
“hyg” = high yield credit
“vtv” = vanguard value fund
“tlt” = iShares bond etf

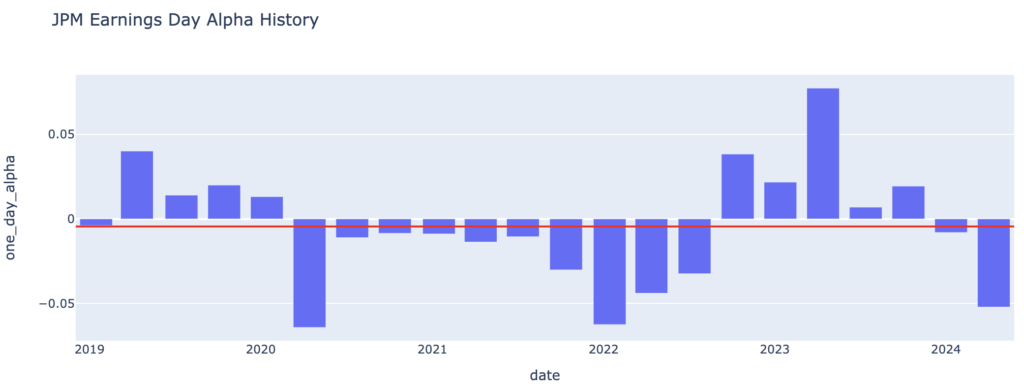
Lastly we will want to keep track of earnings dates.
In JPM’s case, it’s usually a relative underperformer on earnings, going back to 2019 (red bar)

In our next post, we’ll begin putting this all together in a stock picking regime.